
Monitor flag activity
Analyze and manage flags across your entire organization.
The Flag dashboard provides a centralized view of all employee flag activity across your organization, displaying flag counts by employee and type in a table format. Use the dashboard to identify employees or job sites with high flag counts, track flag trends over time, and prioritize resolution efforts for critical timelog issues. The dashboard's filtering and search capabilities help you focus on specific problems.
To access the dashboard, select Flag Dashboard from the left-hand navigation of your MobiClocks Web App. Next, use the date picker to select the time range for which you want to track flag data and choose which flags you want to track from the flags selector. The following screenshot highlights the date picker and flag selector.
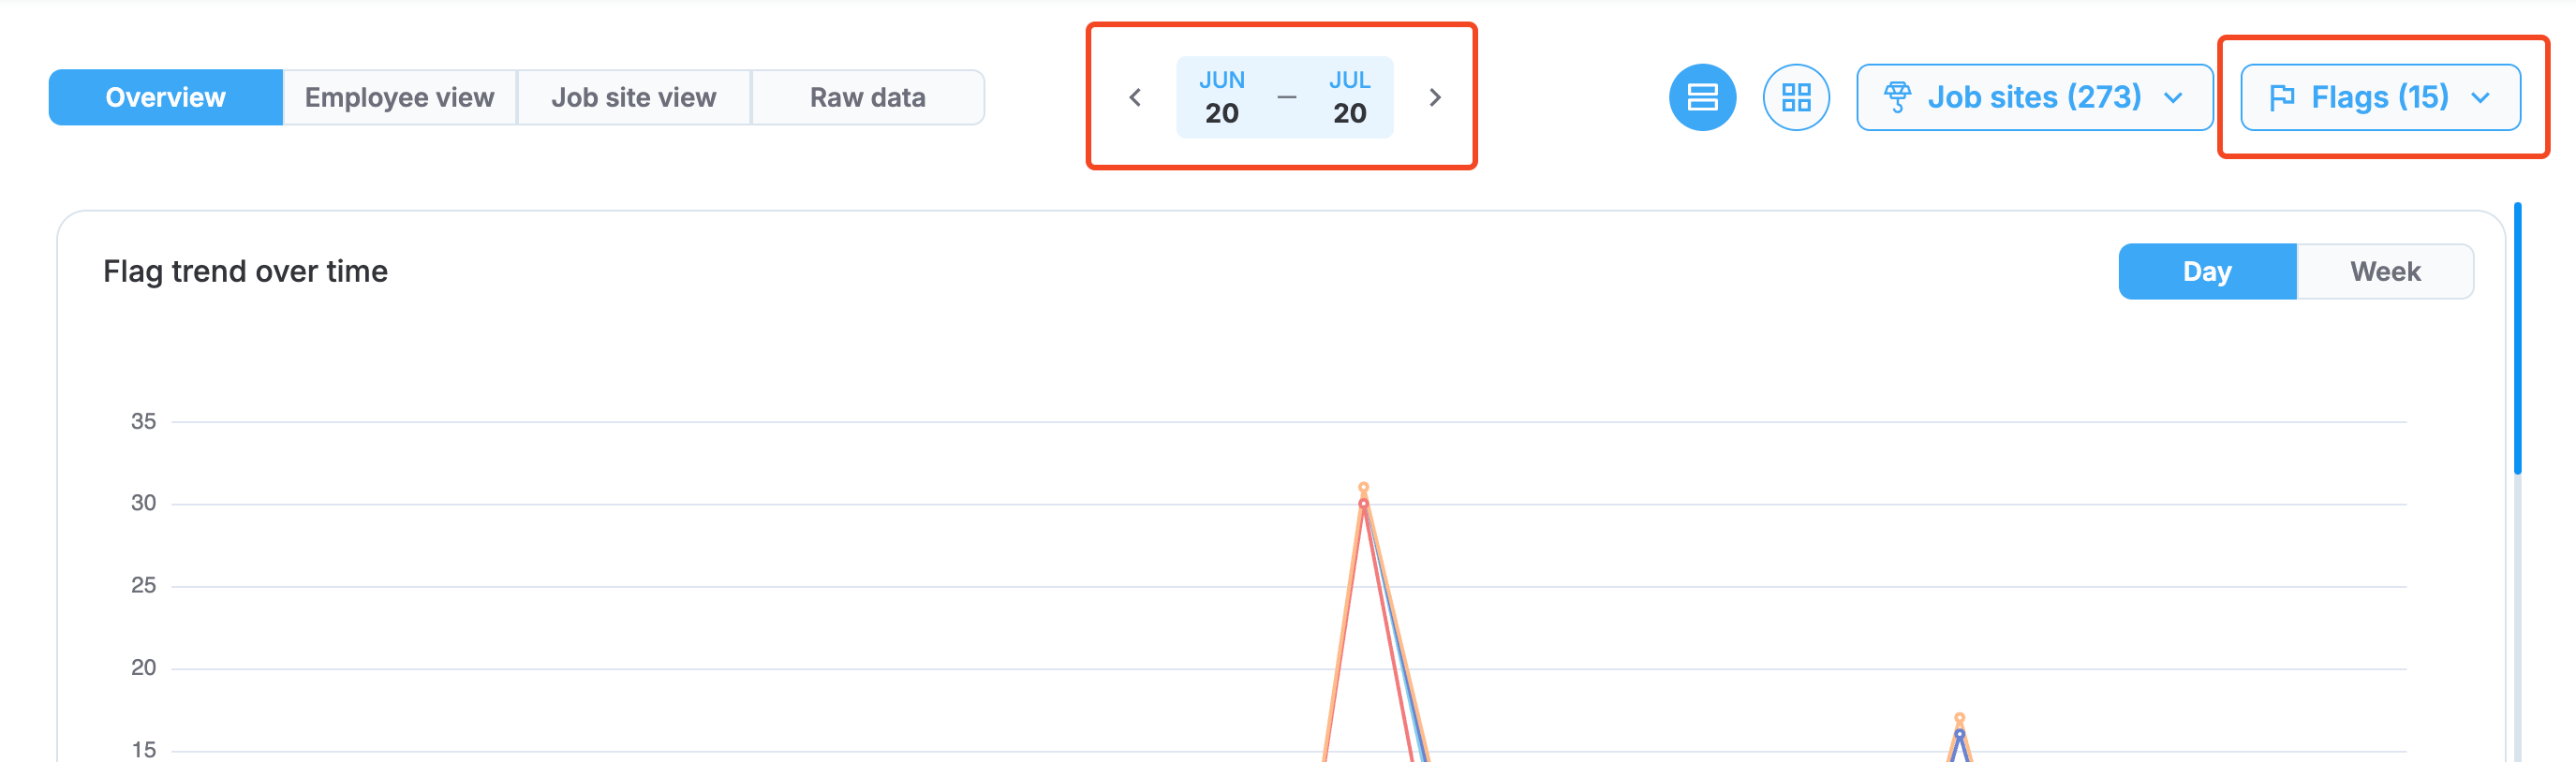
Date picker and flag selector
These two options are common for all four views. Proceed to the following sections of this topic to learn more about each view and its dedicated settings.
PERMISSIONSYou may access the Flag Dashboard if you have the View "Flag Dashboard" tab permission enabled for your role in Administration () > Role Permissions > Flag Dashboard.
Overview view
The Overview displays flag analytics through four interactive charts that transform raw flag data into actionable insights. This view helps you identify trends, monitor resolution effectiveness, and pinpoint areas requiring attention across your organization.
Flag trend over time
Track flag patterns across your organization with a dynamic multi-line chart that reveals critical trends and seasonal patterns.
Chart features:
- Multi-line visualization: Each selected flag appears as a separate colored line for comparison.
- Time view options: Toggle between Day and Week views using the buttons in the top right.
- Interactive hover details: Hover over any data point to see the exact date and breakdown of all the flags for that period.
- Trend identification: Identify whether flag issues are increasing, decreasing, or remaining consistent over time.
The following screenshot shows the flag trend chart in a hovered state.
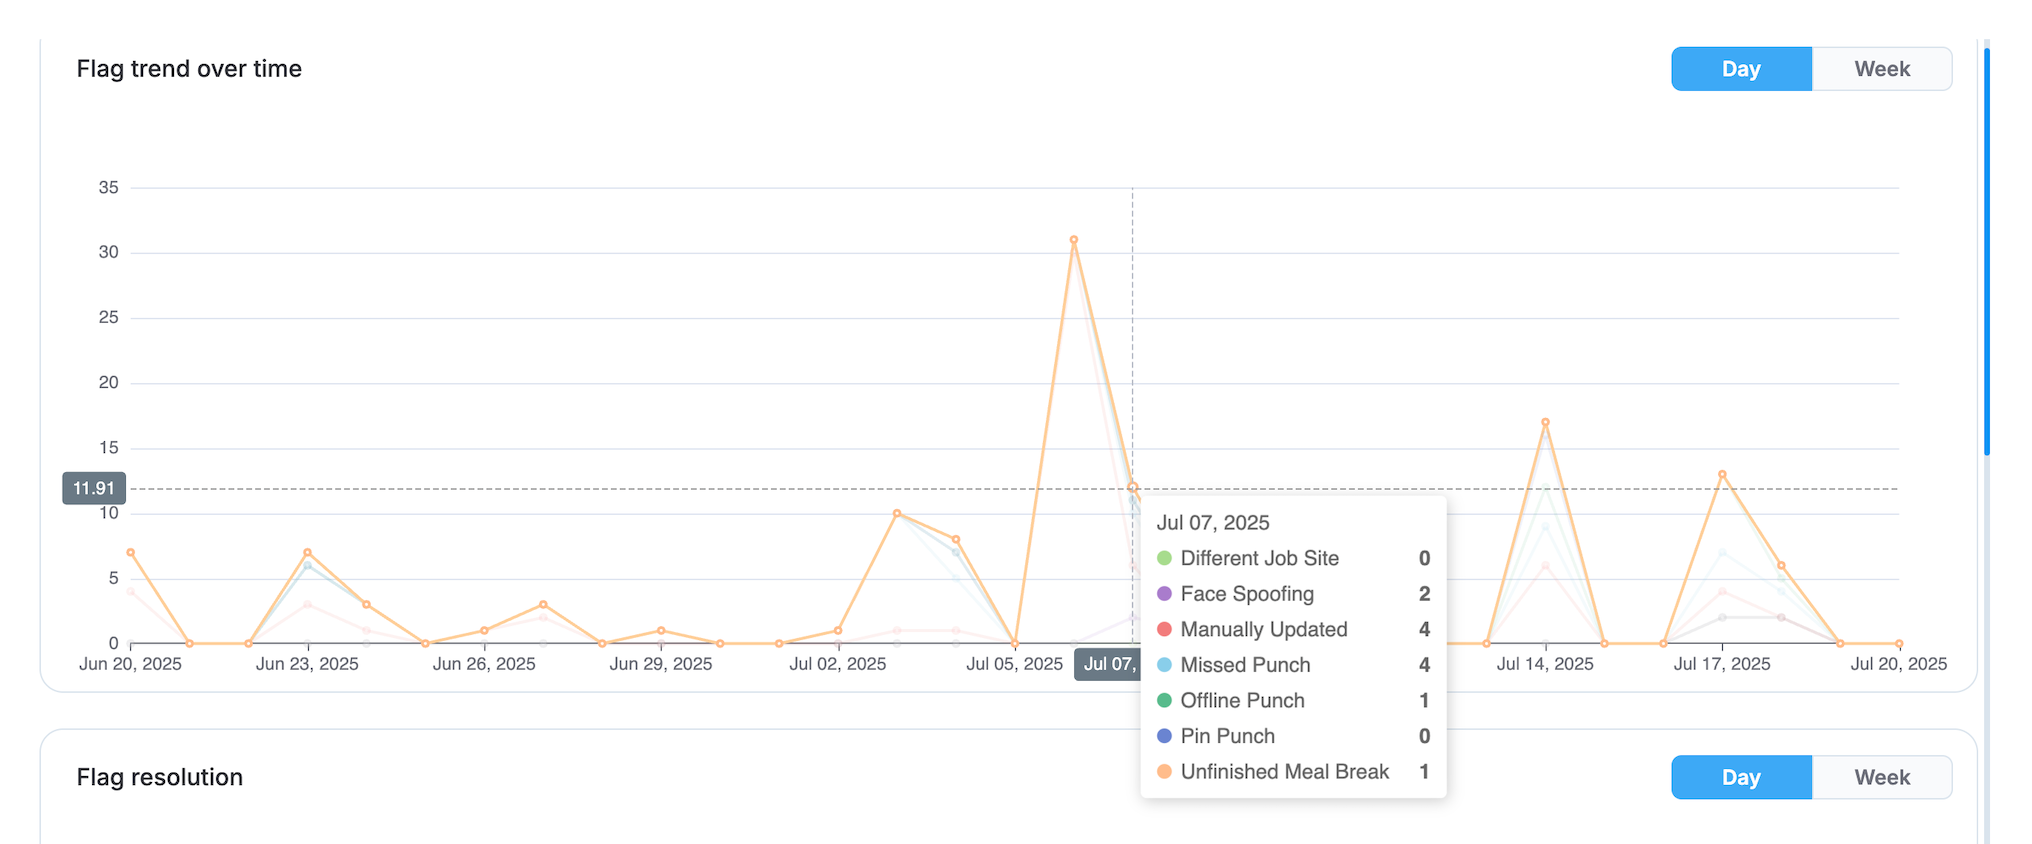
Flag trend over time
Flag resolution
Monitor how effectively your organization addresses flag issues with a stacked bar visualization showing the ratio between resolved and unresolved flags over time.
Chart features:
- Resolution ratio display: Each bar shows the percentage breakdown of resolved versus unresolved flags.
- Color-coded sections: Green portions represent resolved flags, while orange portions show unresolved flags.
- Time view options: Switch between Day and Week data visualization.
- Interactive tooltips: Hover over bars to see exact resolution percentages and dates.
The following screenshot shows the flag resolution chart in a hovered state.
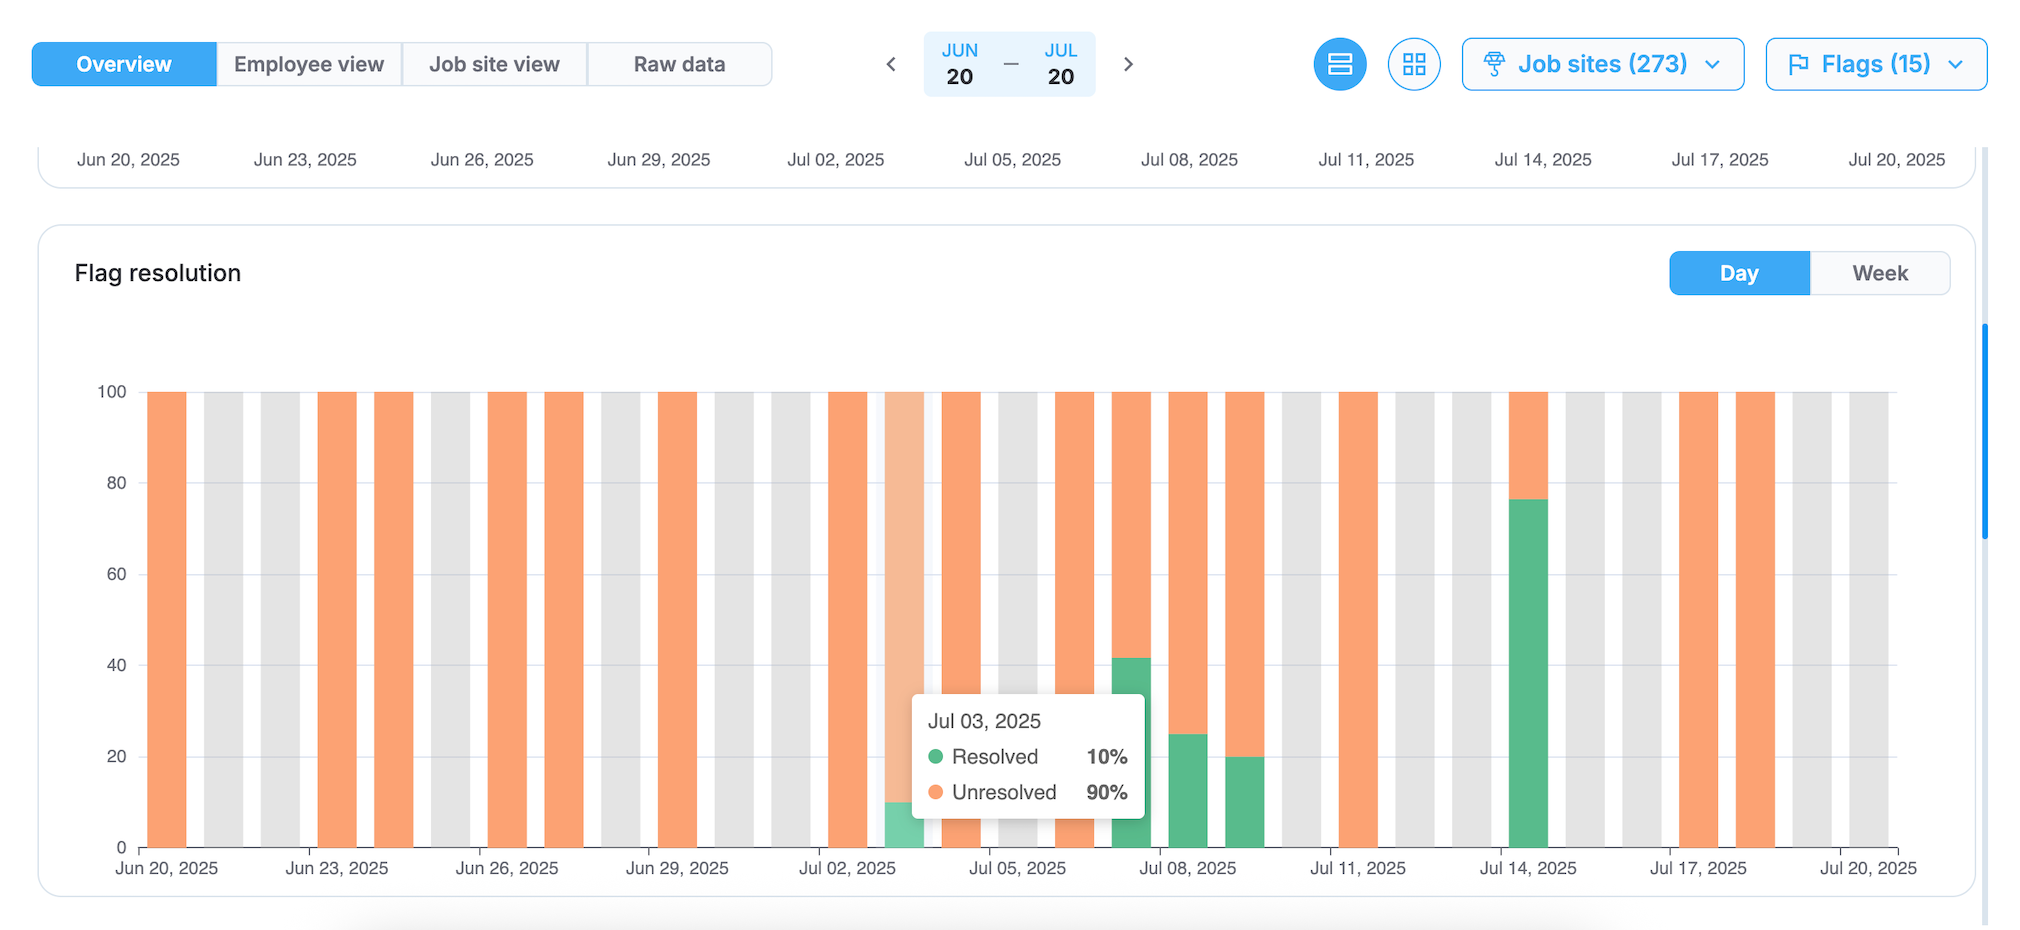
Flag resolution
Flag recurrence per job site
Identify sites experiencing the most flag activity with horizontal bar charts showing flag totals across all employees at each job site.
Chart features:
- Horizontal bar layout: Job sites listed vertically with flag counts extending horizontally for comparison.
- Stacked visualization: Each bar shows breakdown by different flags with distinct colors
- Resolution filtering: Use All, Resolved, or Unresolved buttons to focus on specific flag statuses.
- Interactive details: Hover over any bar to see a detailed flag breakdown for that job site.
The following screenshot shows the flag recurrence chart in a hovered state.
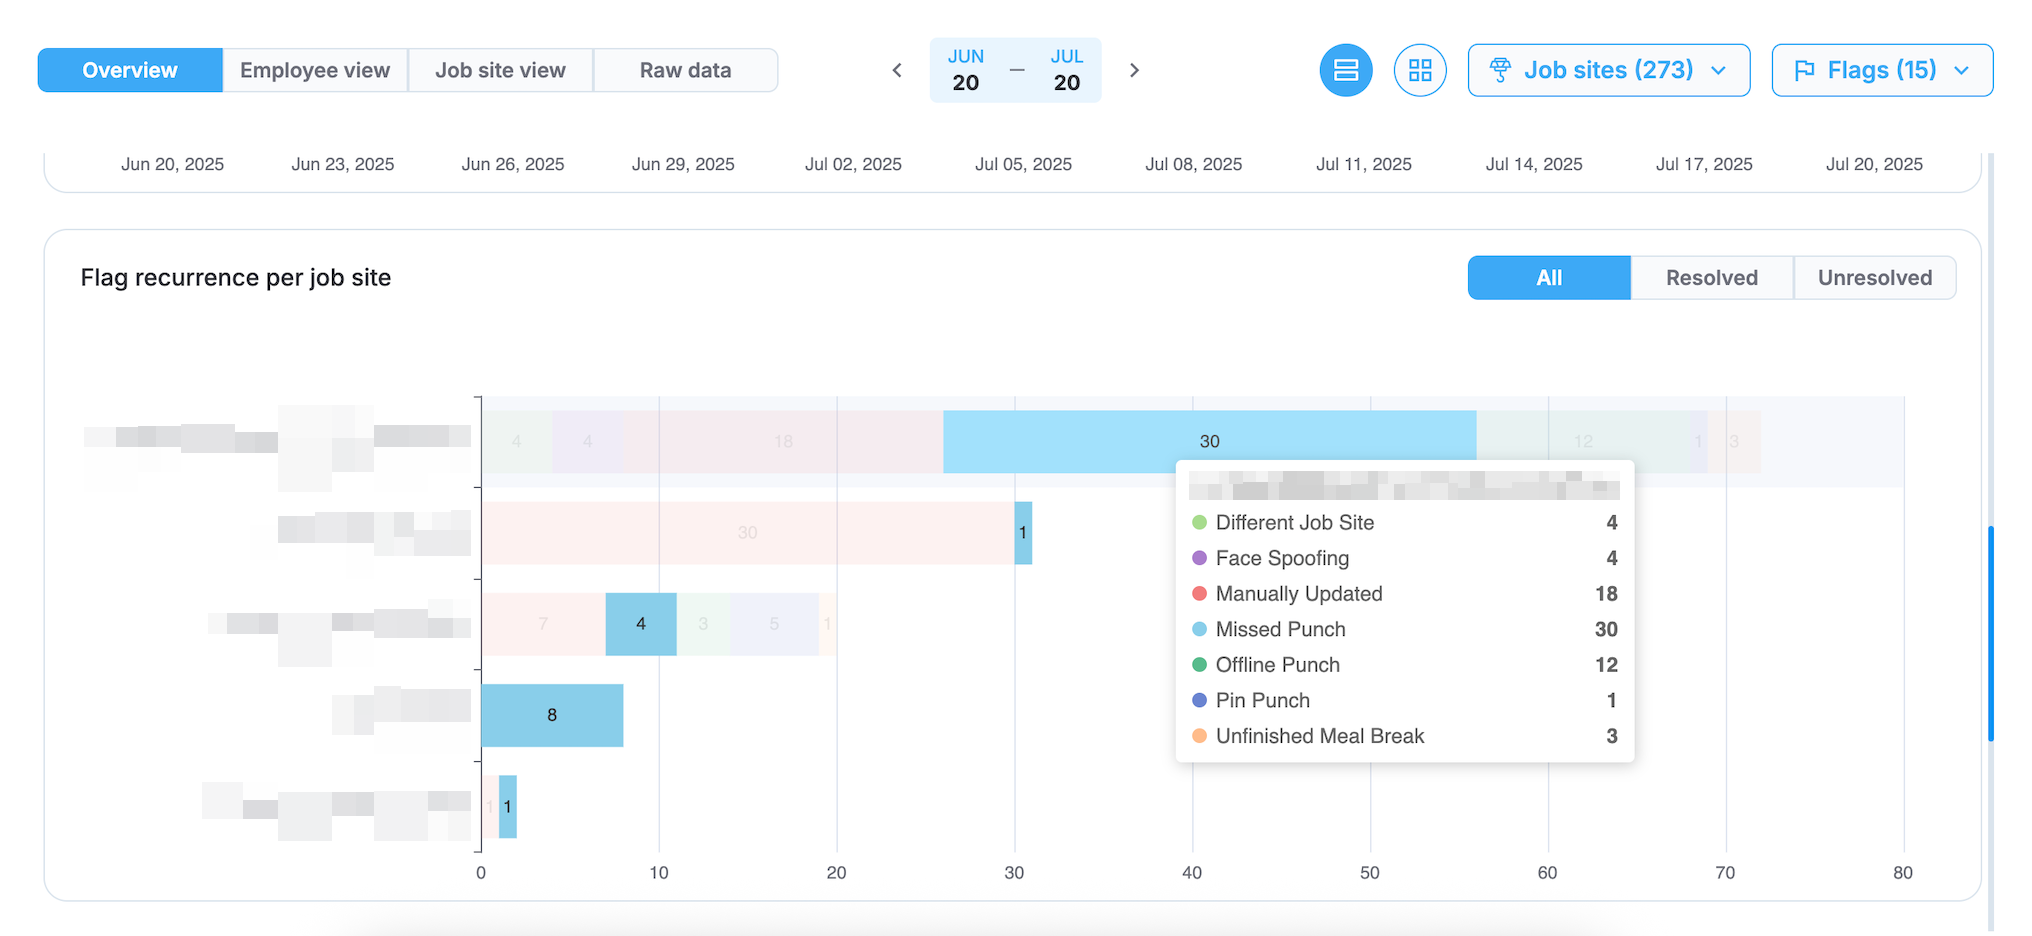
Flag recurrence per job site
Flag recurrence per employee
Focus on individual employee flag activity with horizontal bar charts showing flag frequency by person.
Chart features:
- Employee-focused display: Shows employees with highest flag counts for targeted intervention
- Multi-flag breakdown: Each bar displays different flag types with distinct colors and counts
- Resolution status filtering: Filter by All, Resolved, or Unresolved to focus your analysis
- Detailed hover information: Hover over bars to see complete flag breakdown by type for each employee
- Training identification: Quickly spot employees who may benefit from additional coaching or support
The following screenshot shows the flag recurrence chart.
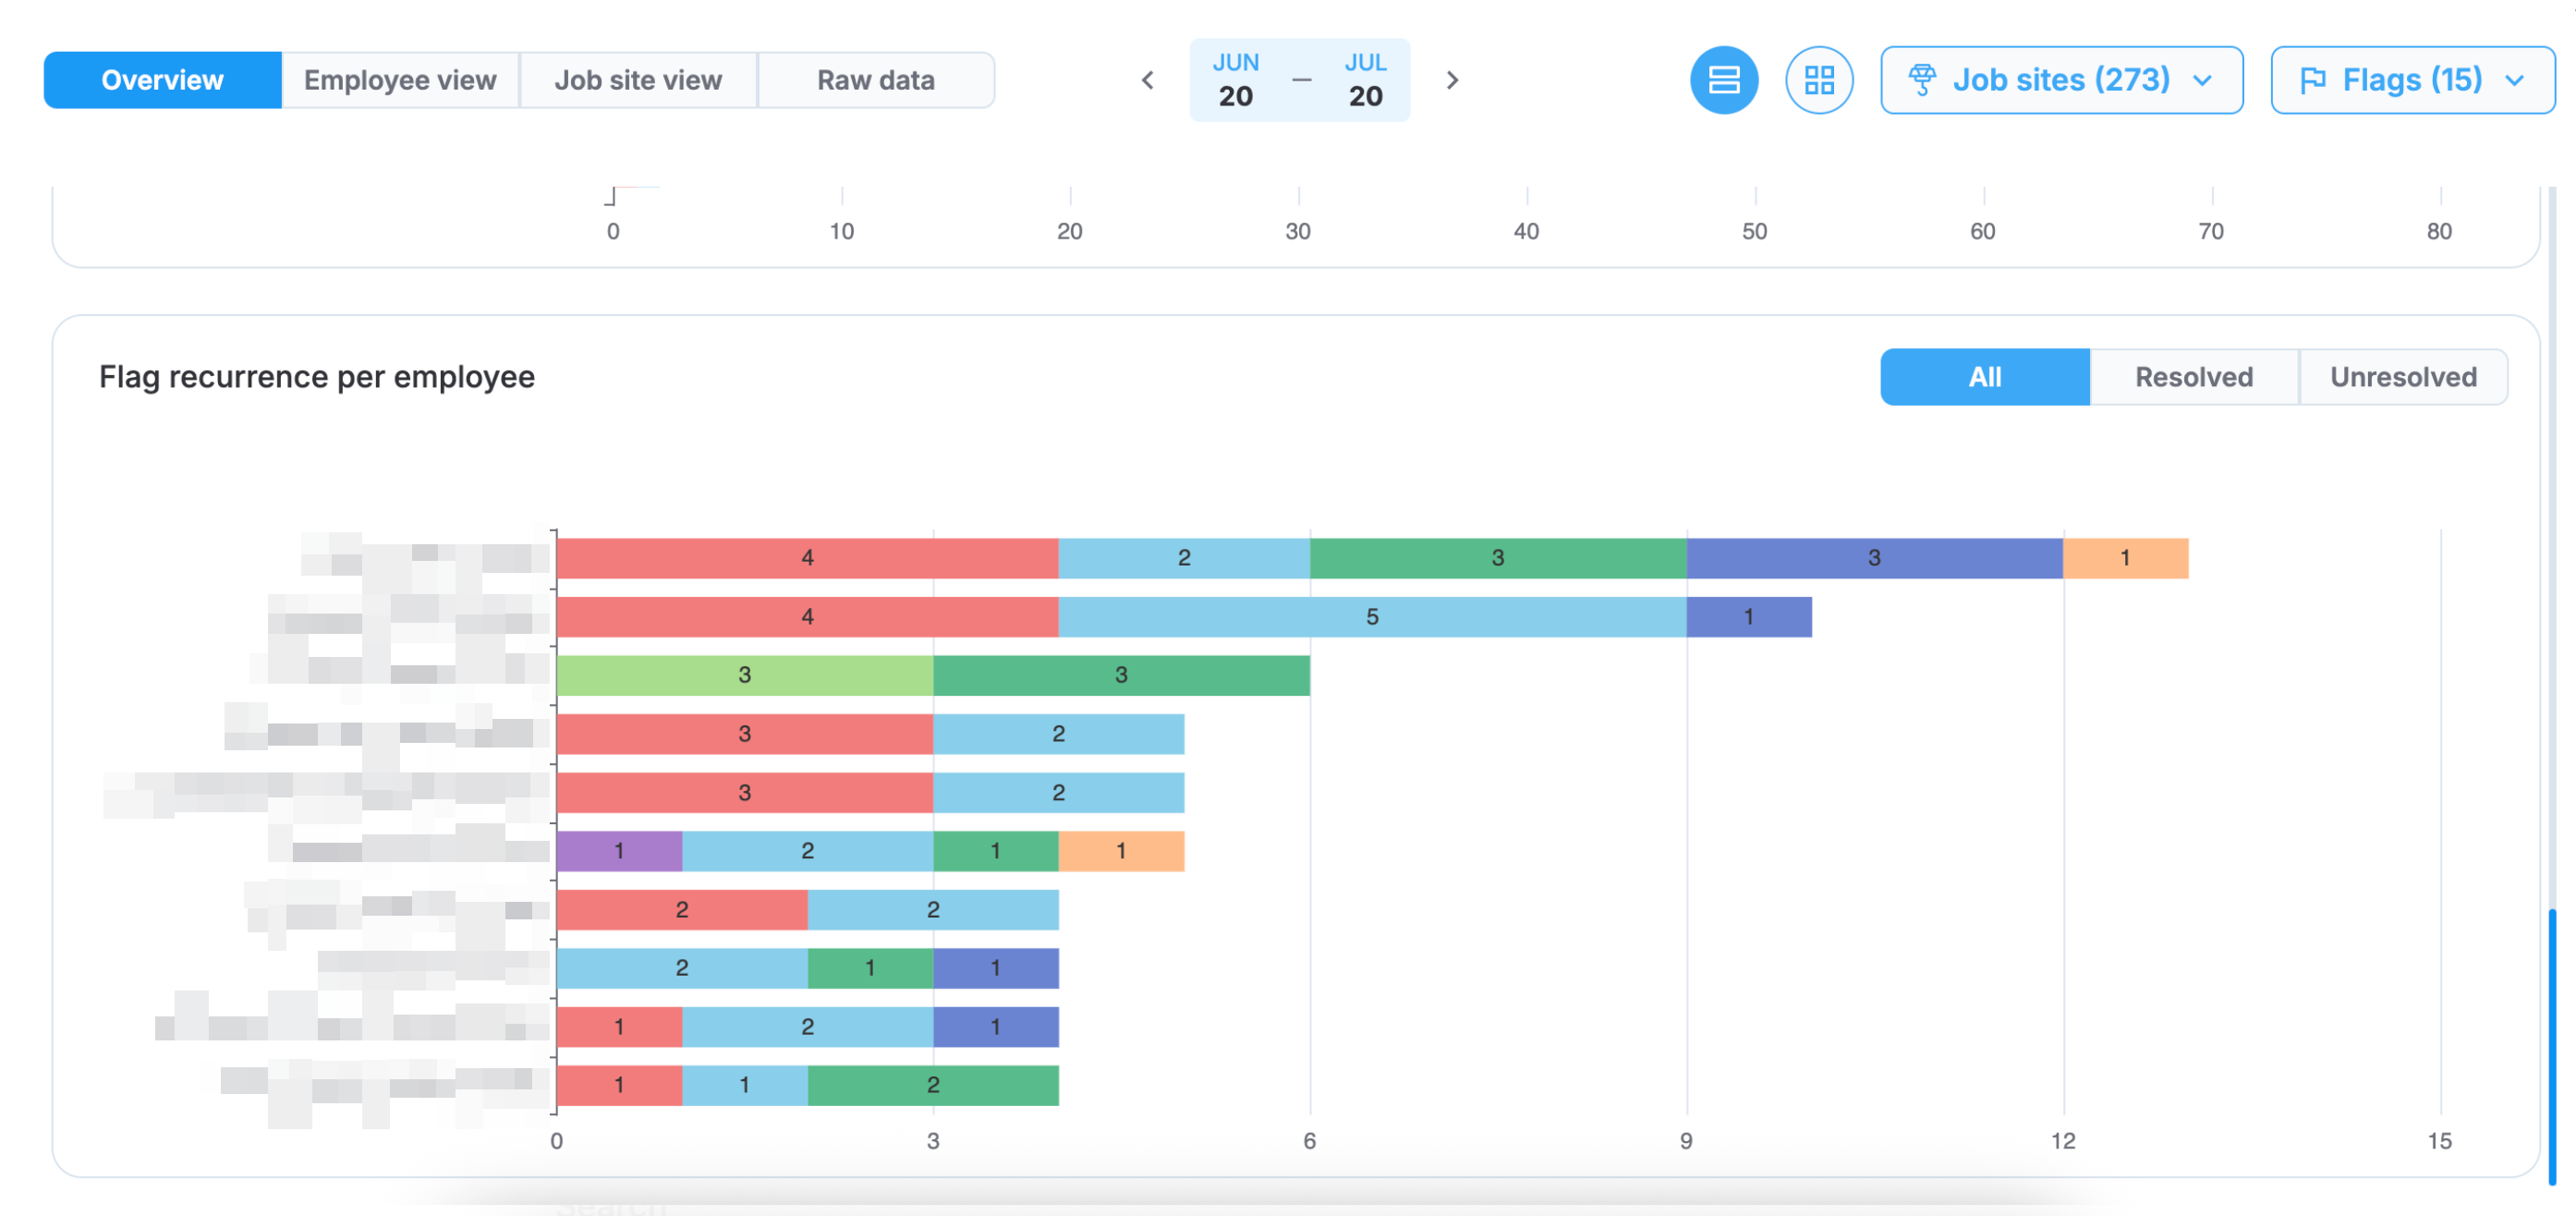
Flag recurrence per employee
Universal chart controls
All charts in the Overview respond to the same filtering controls:
- Date range: Use the calendar picker to select your analysis period.
- Arrangement setting: Choose between separate chart display or grouped layout.
- Job site filtering: Choose specific job sites using the Job sites dropdown.
- Flag selection: Select which flag types to display using the Flags dropdown.
- Real-time updates: Charts refresh instantly when filters change.
Employee view
The Employee view displays all employees in your organization who have flags during the selected period. This view helps you focus on individual employee flag activity and take targeted resolution actions.
The view includes the following fields:
- Employee: Shows the employee name and employee number.
- Total: Displays the total count of all flags for each employee.
- Flag columns: Display the count of each specific flag for each employee.
Search
Use the search bar under the Employee column to search by employee name or number.
Take action on employee flags
Select any employee name to access their timelogs for the selected period. From there, you can review individual timelog details and resolve flags as needed.
Example
In the following screenshot, Alejandro Beltran has two Manually Updated flags and one Missed Punch flag, indicating areas that need attention for this employee.
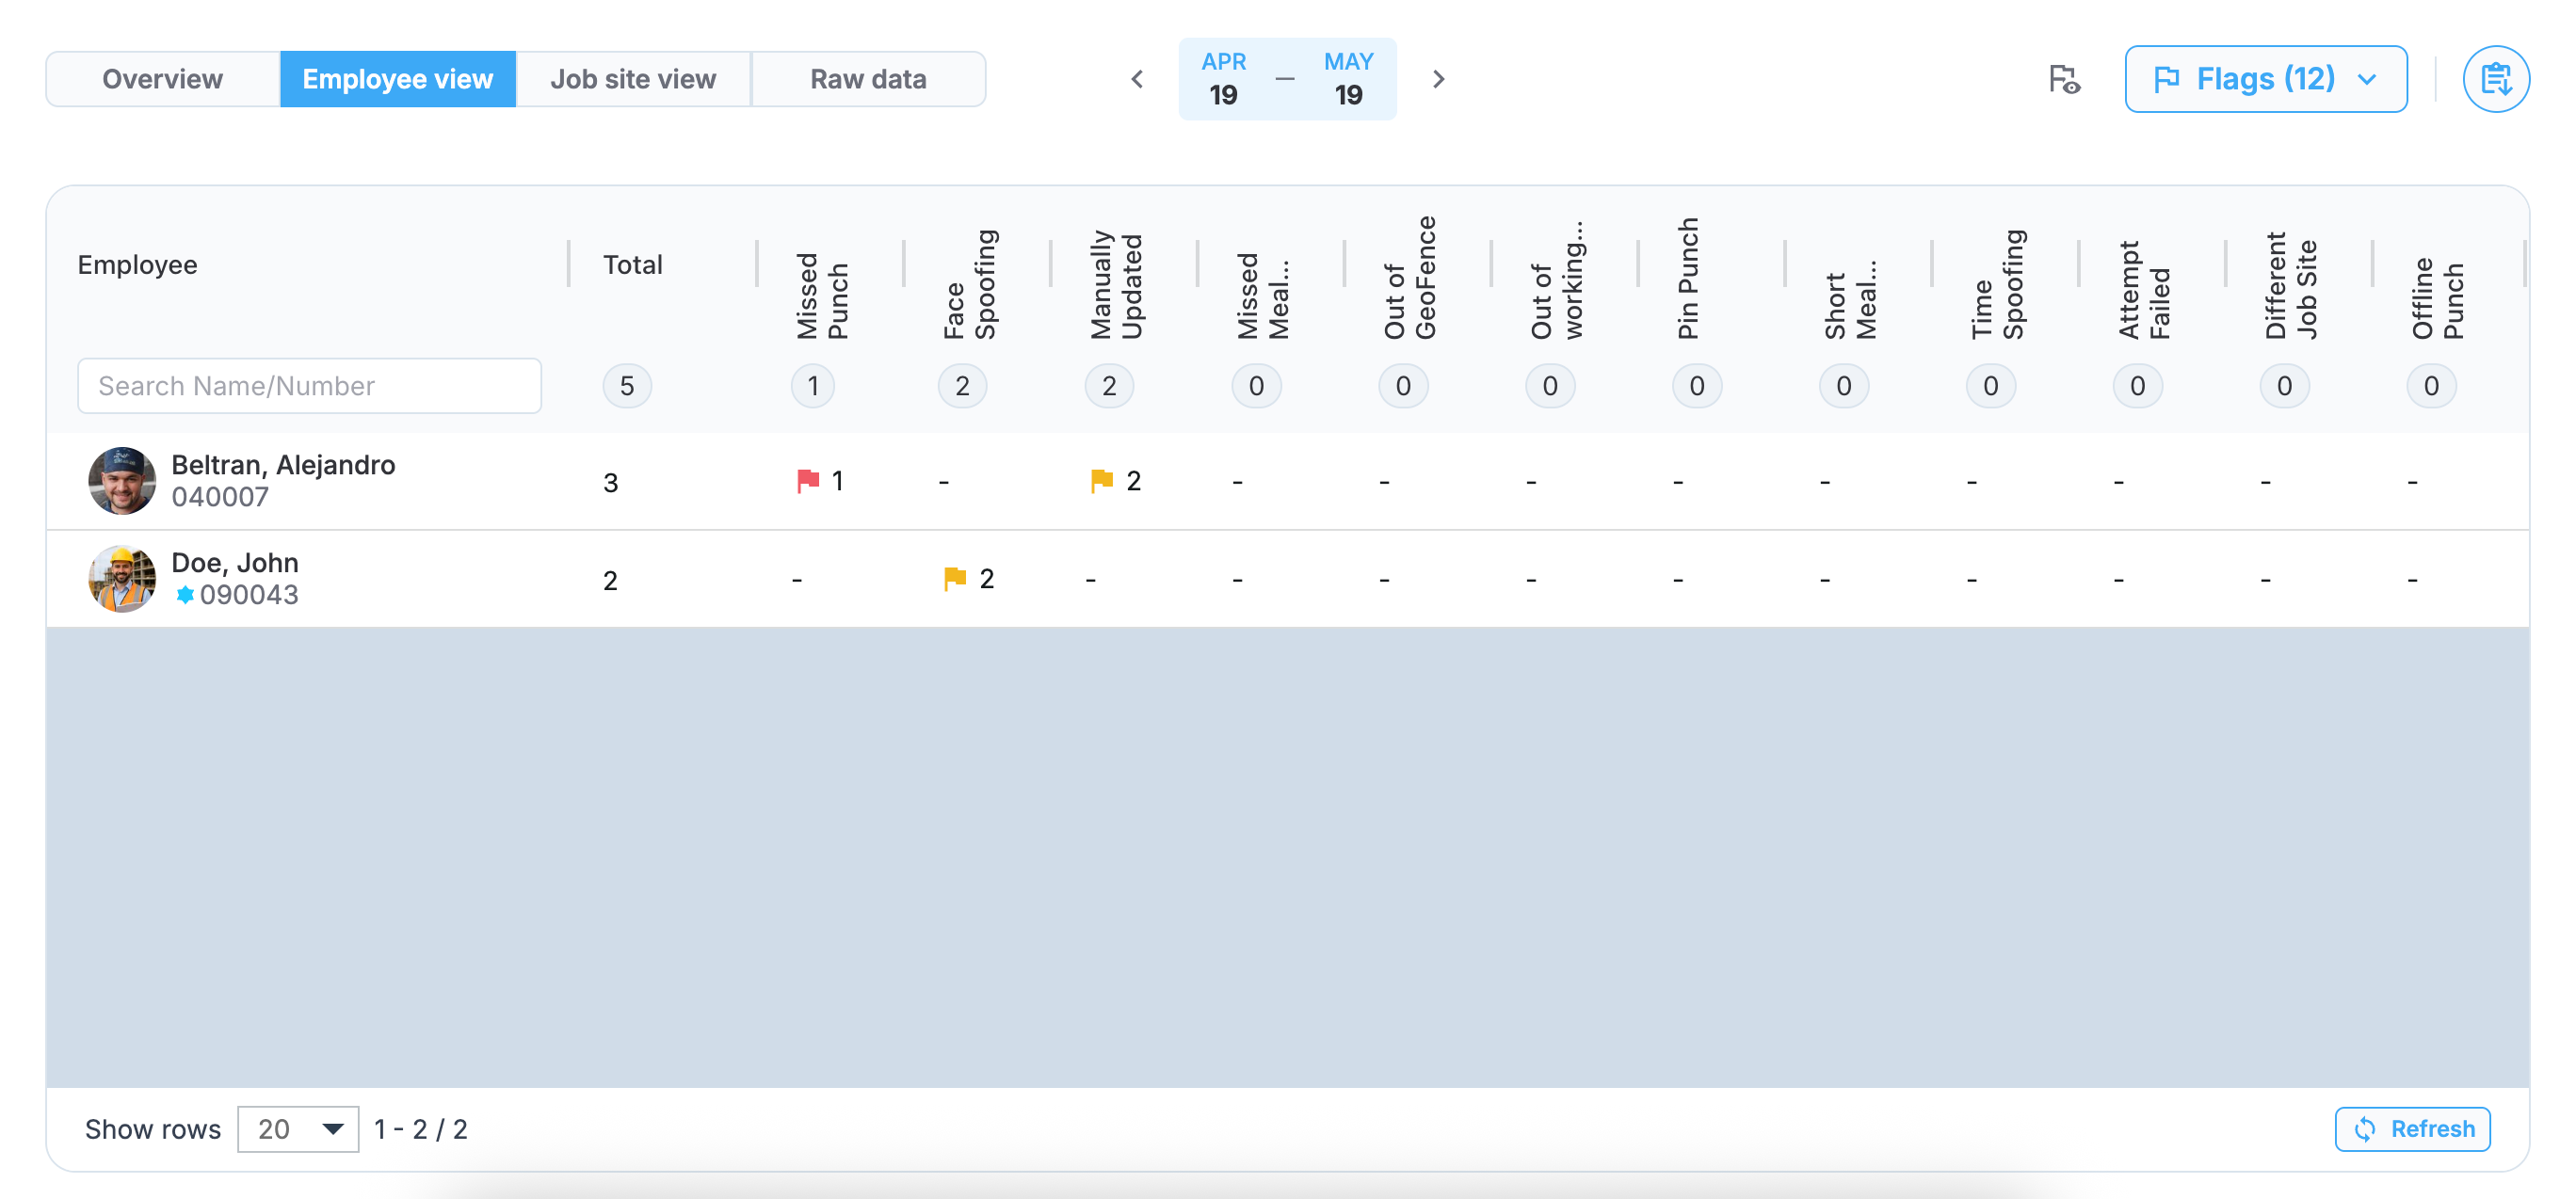
Employee view in Flag dashboard
Job site view
The Job site view displays all job sites in your organization that have flags during the selected period. This view helps you identify site-specific flag patterns and address site-wide issues that may require targeted training or policy adjustments.
The view includes the following fields:
- Job site: Shows the job site name and number
- Total: Displays the total count of all flags for each job site
- Flag type columns: Display the count of each specific flag type for each job site
Filter by job site
Use the All dropdown to focus on a specific job site, or keep it set to All to view flag activity across all locations in your organization.
Example
In the following screenshot, the TitanCraft Connstruction job site has 2 total flags (both Face Spoofing flags), while the Alpine Edge Project job site has 3 total flags (1 Missed Punch flag and 2 Manually Updated flags), indicating different types of issues at each location.
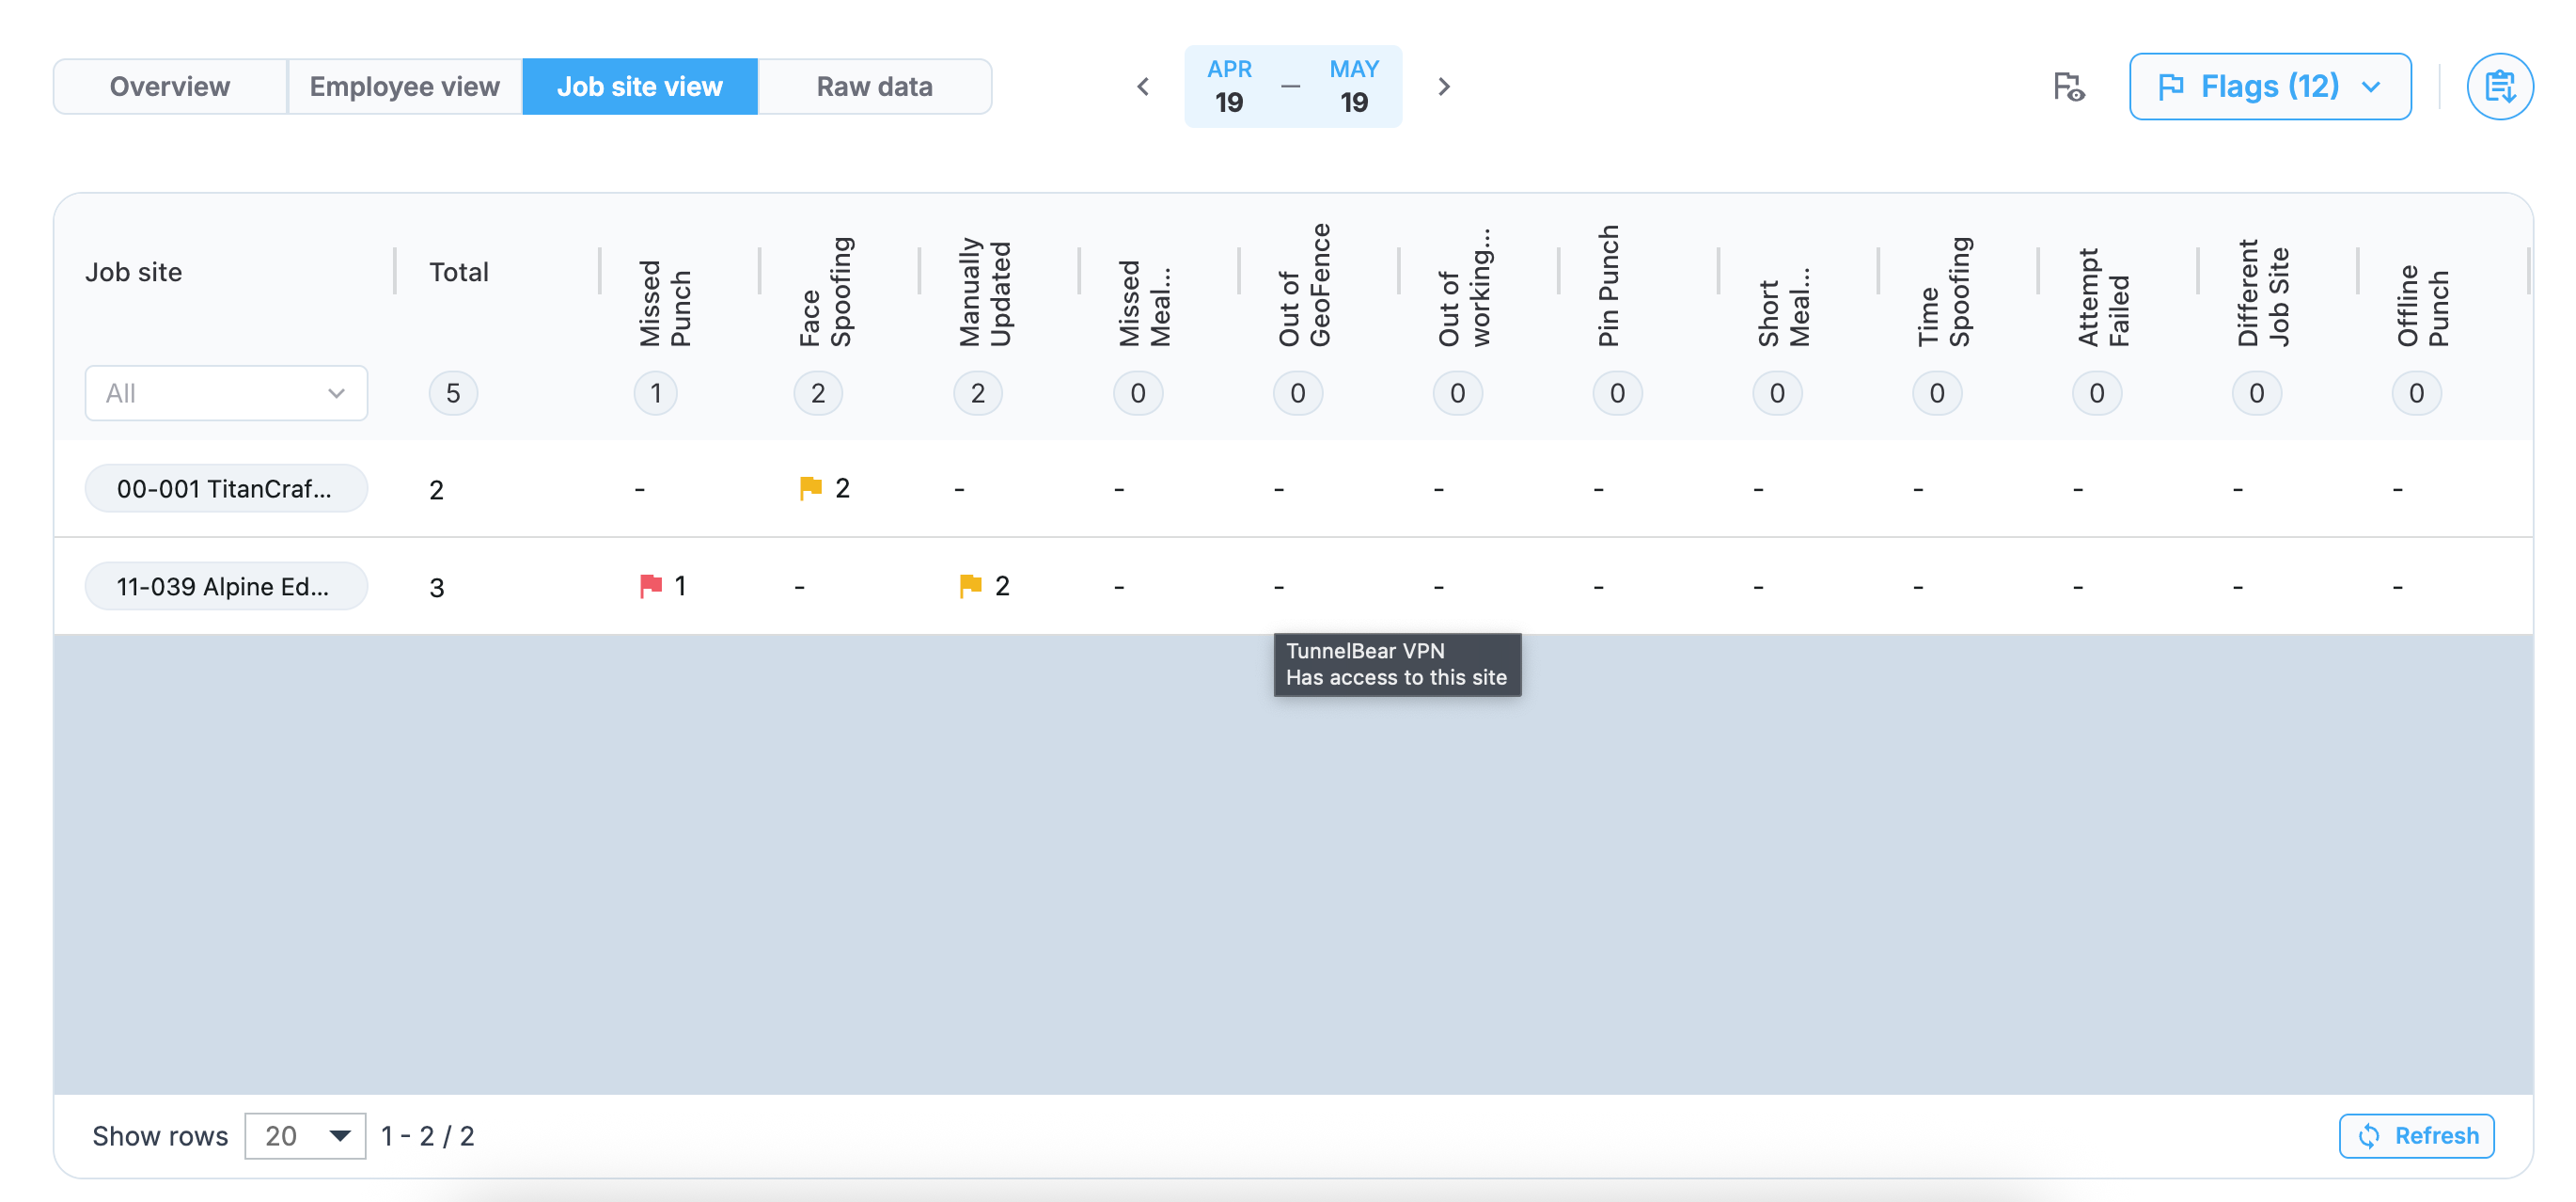
Job site view in Flag dashboard
Raw data view
The Raw data view displays individual flag records in a detailed format during the selected period. This view provides the most granular level of flag information and is suited for detailed analysis and reporting.
The view includes the following fields:
- Employee: Shows the employee profile picture, name, and employee number.
- Job site: Displays the job site name and number where the flag occurred.
- Date: Shows the specific date when the flag was applied.
- Flag: Indicates the flag name with color coding. See Manage flag settings for more details.
- Resolved by: Shows who resolved the flag (empty if unresolved).
- Resolved date: Displays when the flag was resolved (empty if unresolved).
Filter and search capabilities
Use the filtering tools to narrow down your data:
- Search Name/Number: Find specific employees by name or employee number.
- Job site dropdown: Filter flags by specific job sites or view all sites.
- Flag dropdown: Filter by specific flag or view all flags.
Example
In the following screenshot, the data shows multiple flag instances including Alejandro Beltran with Manually Updated flags on May 4th and 7th, and a Missed Punch flag on May 15th, all at the Alpine Edge Project job site. John Doe has two Face Spoofing flags from May 18th at the TitanCraft Construction job site, with all flags currently unresolved.
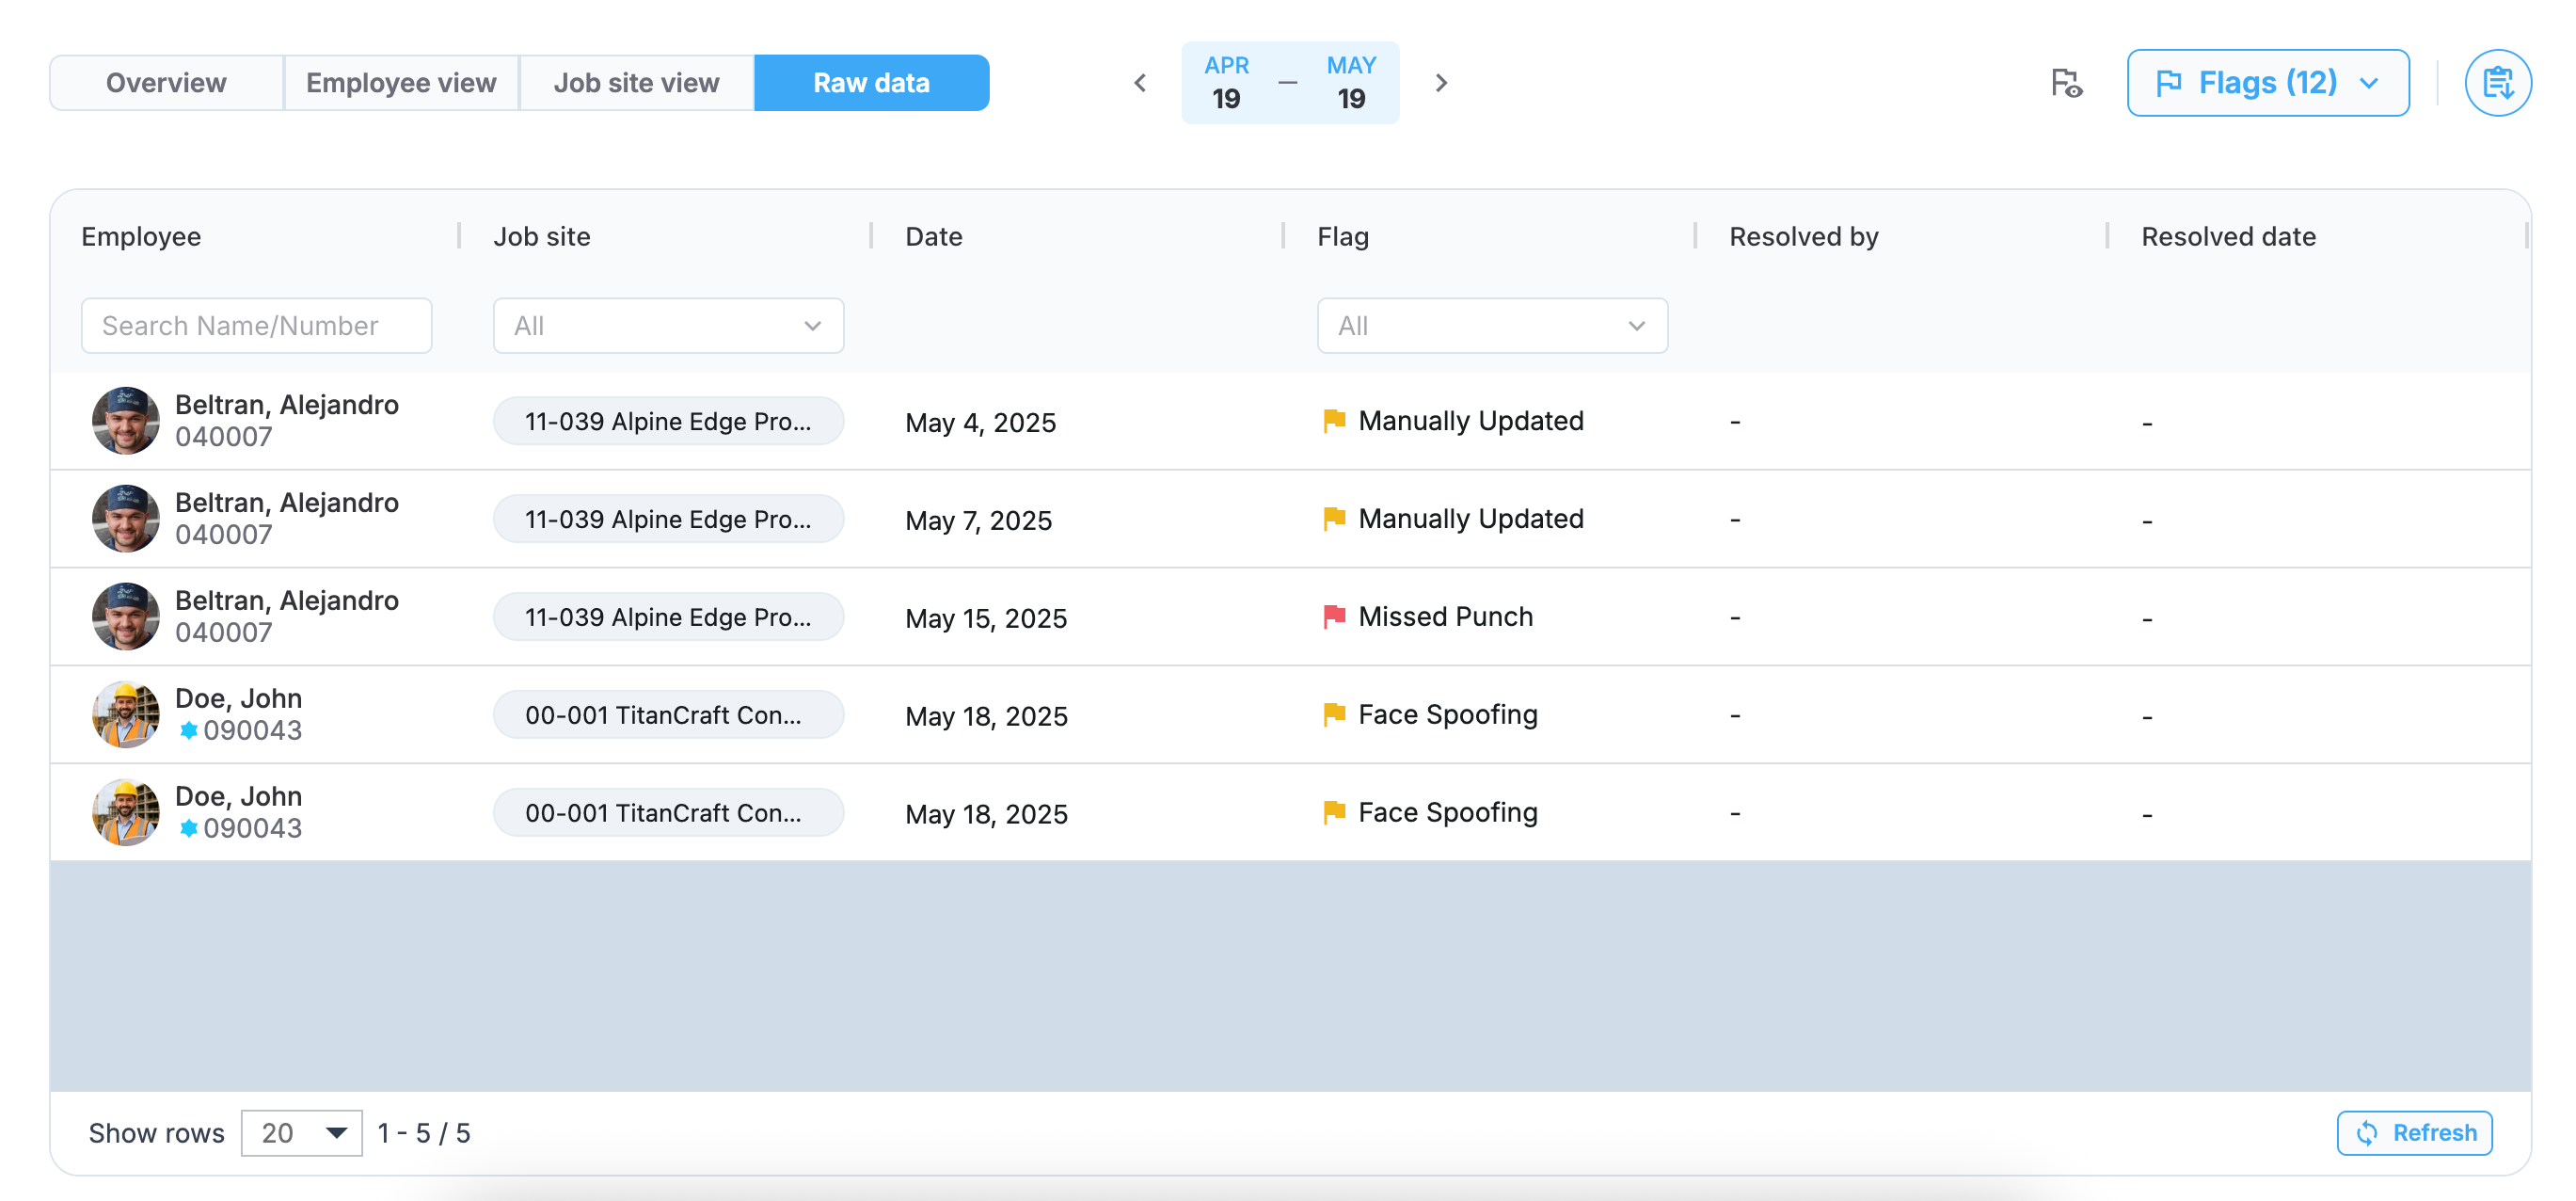
Raw data view in Flag dashboard
Resolution status filtering
For the Employee, view, Job site view, and Raw data sections, a resolution status filter is available to filter flags based on their current status:
- All: Show both resolved and unresolved flags.
- Resolved: Display only flags that have been addressed.
- Unresolved: Focus on flags that still need attention.
The following screenshot highlights the resolution status filter in the dashboard.
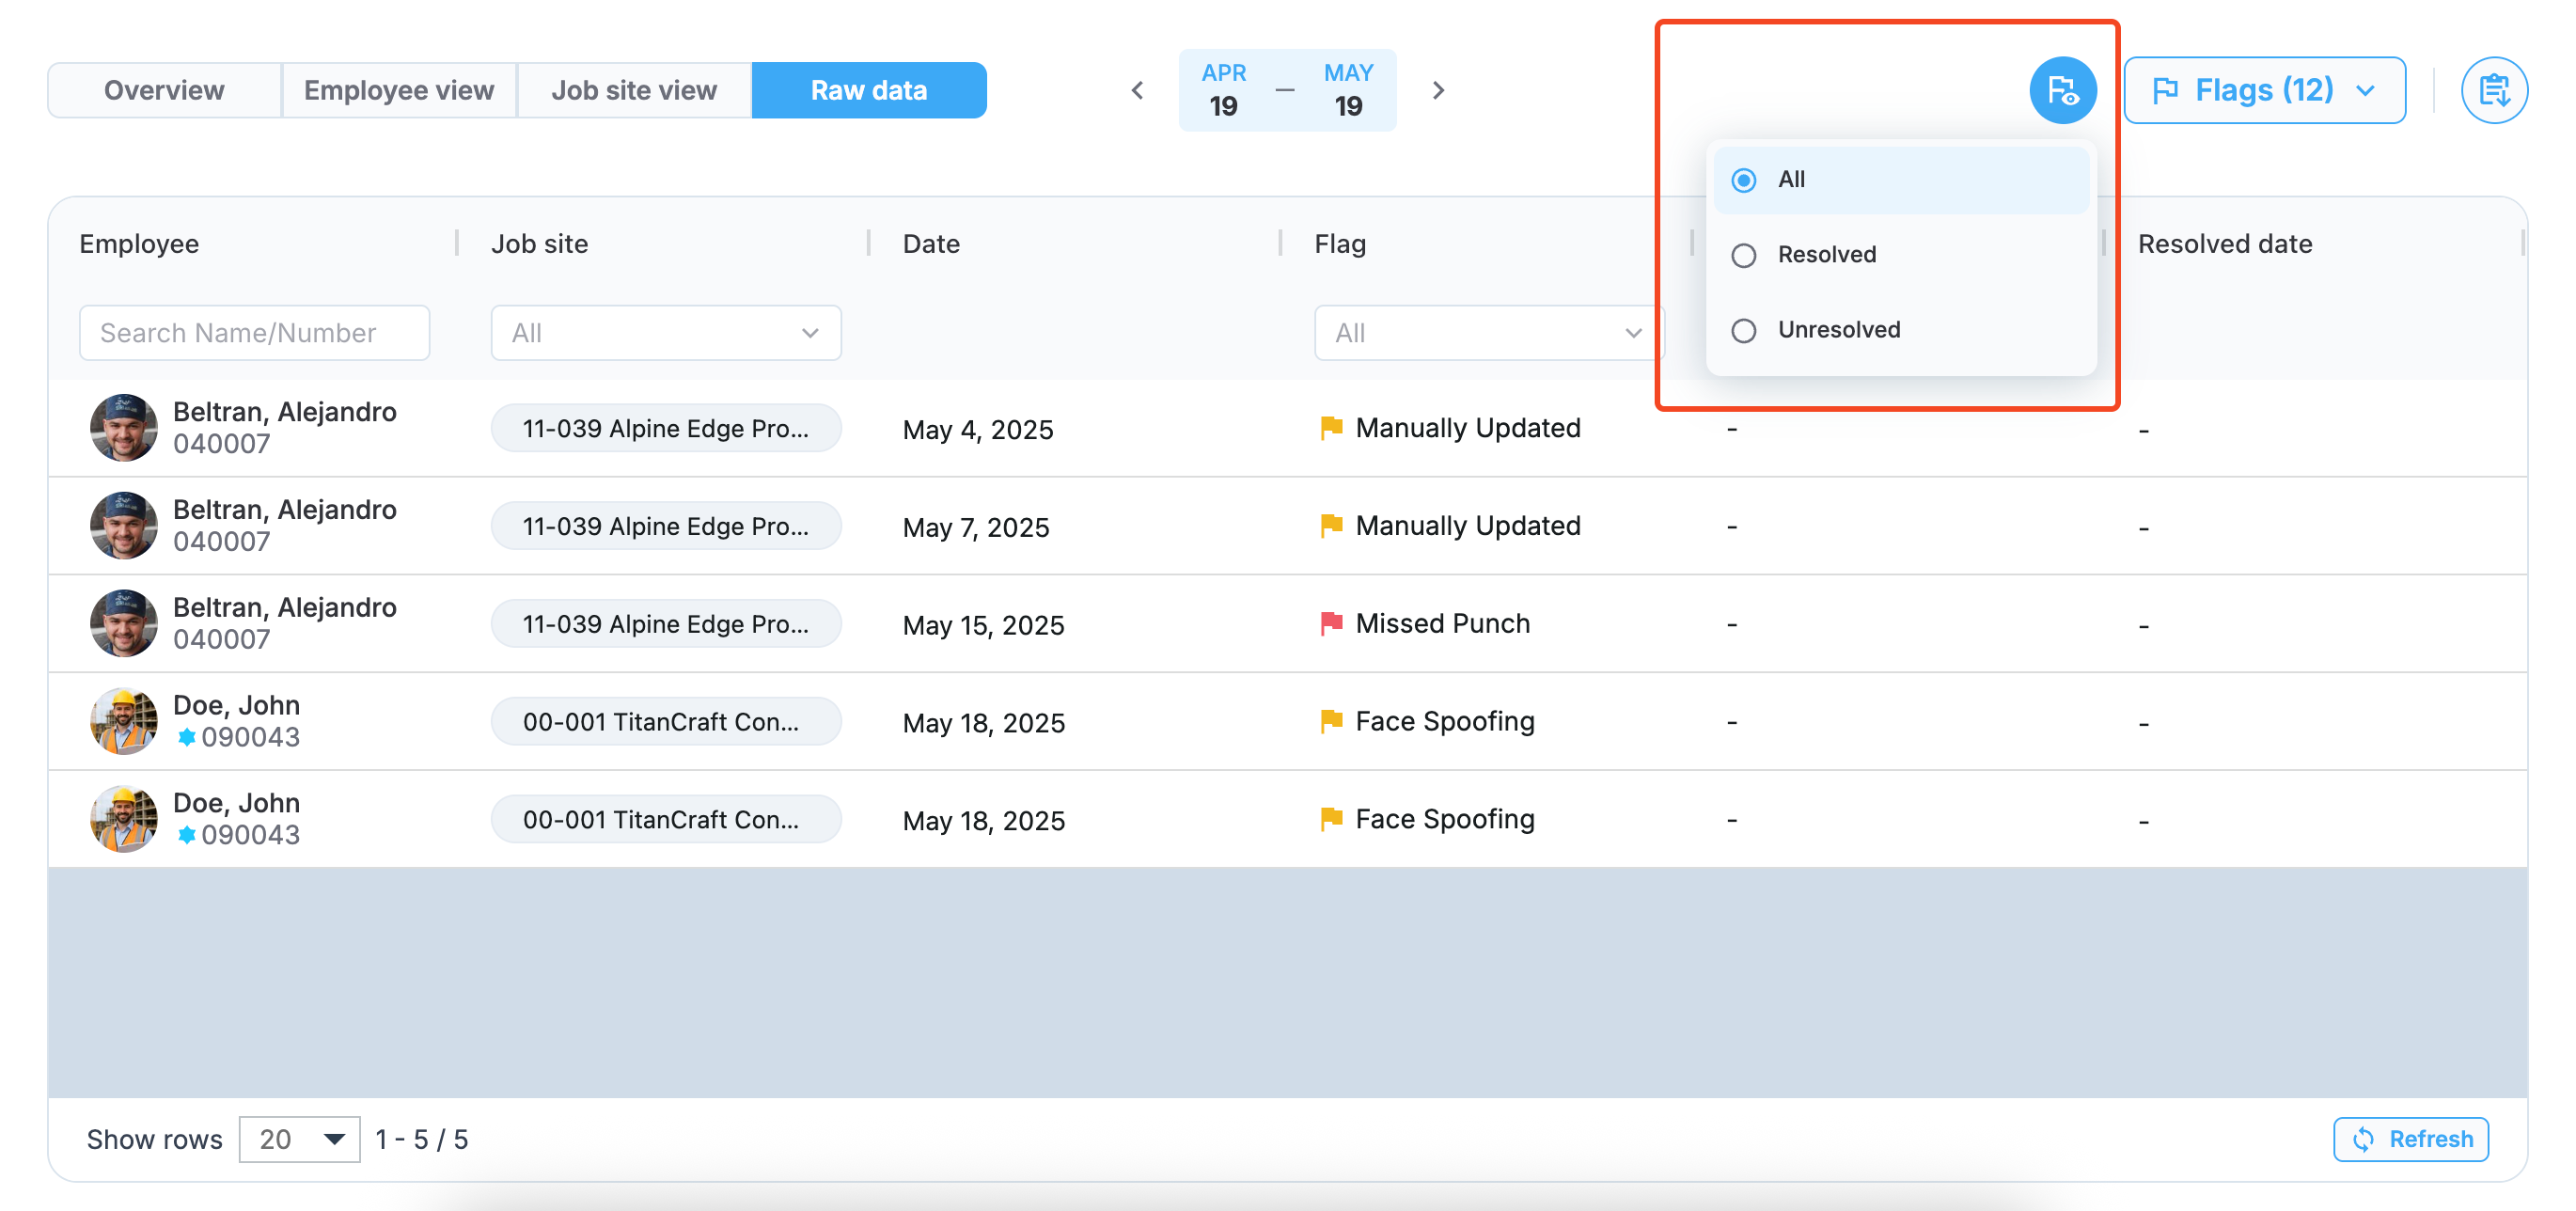
Flag resolution status filter
Exporting
Use the export option in the upper-right corner of the page to export the selected view in an XLSX format.
Updated about 1 month ago