
Job site overview
Visual representation of job site's activities.
Each job site has an Overview section where you have a visual representation of the employee attendance dynamics. To navigate to the Overview section, select a job site from the job site list and open the Overview tab. Here, you have two sections named Manpower and Daily activity. Continue to the following parts of this topic to learn more about each section.
Manpower
In the Manpower section, you have a customizable area chart where on the x-axis you have the date, and on the y-axis, you have the number of employees. Thus, you can see how many employees have attended the job site on any particular day as well as see the attendance dynamics throughout the selected period. The chart also has various grouping and filtering options, which are discussed next.
By default, the chart shows data for the current week with preselected grouping and filtering settings. Perform the following steps to adjust the chart to your needs.
Select a date range
First of all, you need to specify the date range of the chart. There are some commonly used options such as Last 7 days or Last 30 days, but you can also set a custom range using the Custom date range option.
Choose a grouping
At the top of the chart, you have an option to group the data by one of the available parameters. You have the following options:
- By companies. Group the data by the employee companies.
- By job titles. Group the data by employee job titles.
- By crew tags. Group the data by employee crew tags.
Apply filtering
Next, each grouping view has its relevant filters. For example, in the job titles view, you have a list of all the job titles. You can hover over a job title to highlight it in the chart or select it to hide it from or show it in the chart. Additionally, all the grouping views, apart from the company view, have a company filter that you can use to filter the data by one or more companies. The following GIF shows the process of filtering the data by a company in the job titles grouping as well as filtering out data for a few job titles.
Filtering manpower data
If you have connected a subcontractor to your job site, the subcontractor appears in the list of companies and has a connection icon next to its name in the company filters. The following screenshot highlights a subcontractor company in company filters.
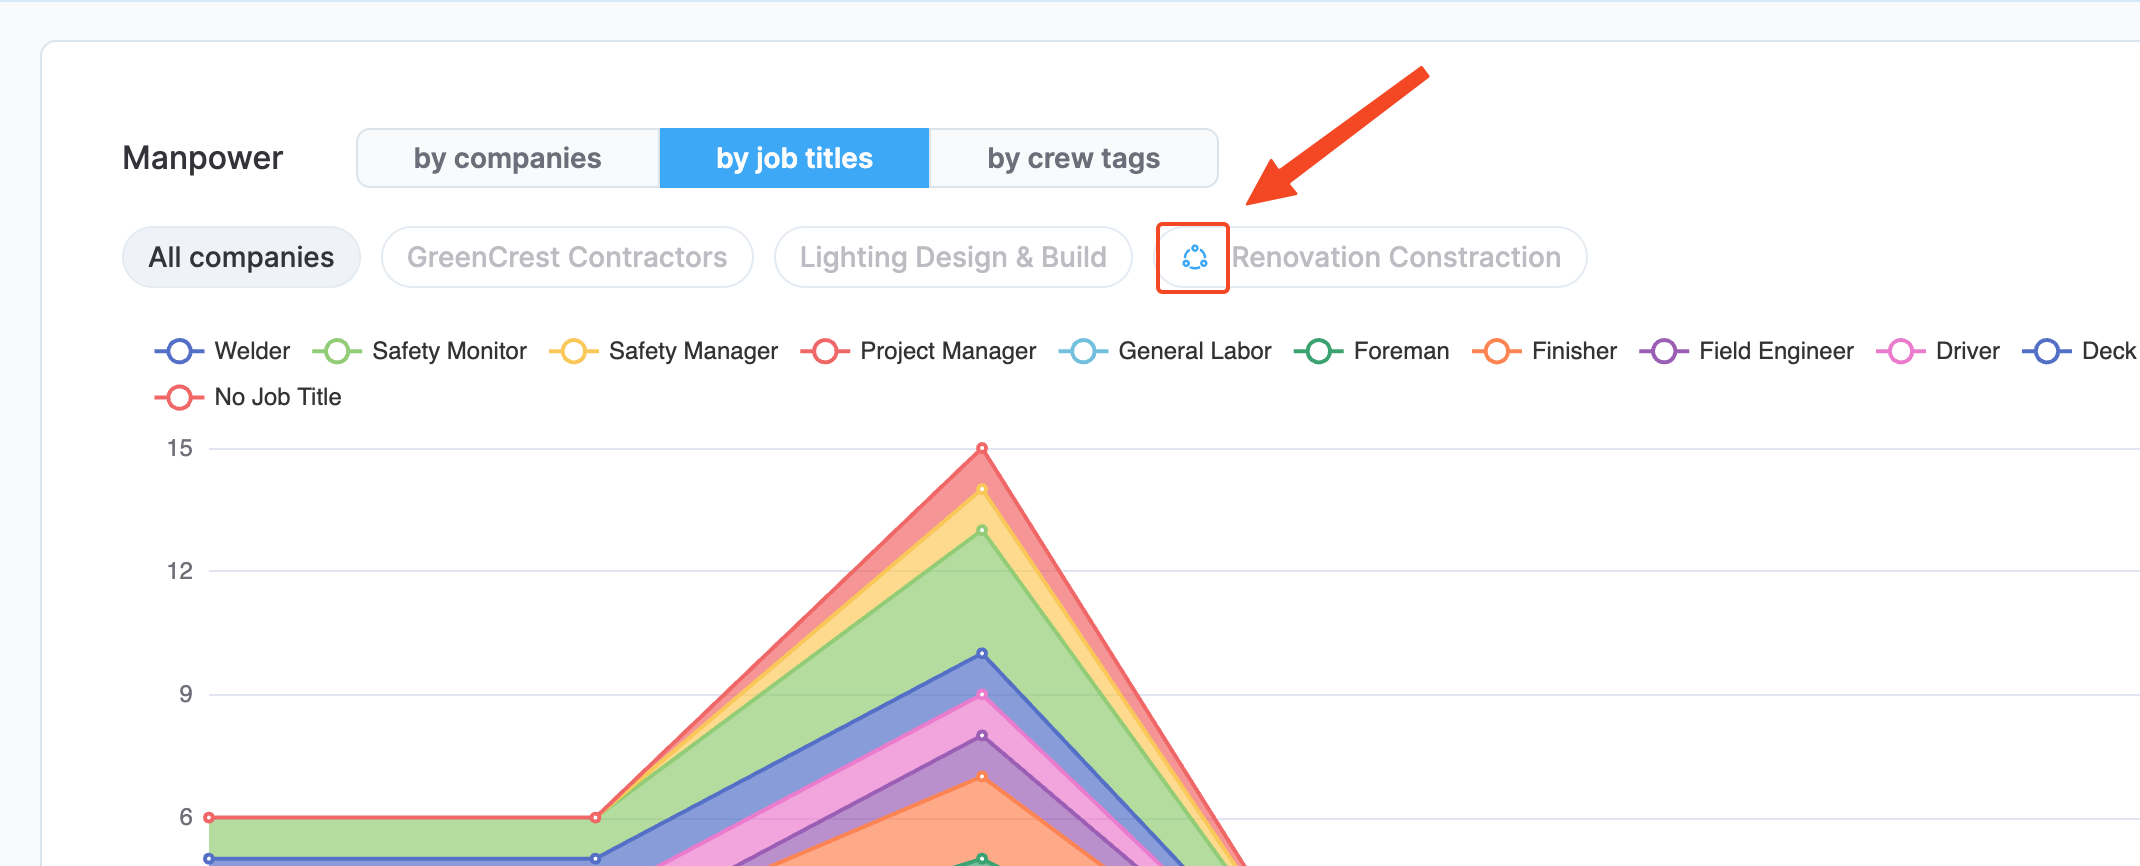
Subcontractor company in the list of company filters
Access manpower numbers and the list of employee profiles
After you have customized the chart based on your preferences, you can hover over the chart to learn specific numbers and access employee profiles. For example, if you've grouped the chart by job titles, you can hover over a specific day to view the manpower numbers for each job title in a pop-up as well as select any of the job titles in the pop-up to open the list of corresponding employees. In the following GIF, the user hovers over the days of the week, viewing manpower numbers, and, in the pop-up for Tuesday, selects the Finisher job title to view the list of employees.
Accessing manpower numbers and employee profiles
Daily activity
The purpose of the Daily activity chart is similar to that of the Manpower chart, but it provides a more low-level overview of employee attendance and activity. Here, you have a bar chart that shows employee attendance dynamics for a selected day. Thus, you can see how many employees have been active (have punched in to the job site) at any given hour of the day.
By default, the chart shows data for the current day with preselected filtering settings. Perform the following steps to adjust the chart to your needs.
Select a date
First of all, you need to specify the date for which you want to view the daily activity.
Customize filtering settings
Next, you have the company filter that you can use to filter the employees by their companies. You can select any of the company names to show or hide corresponding data from the chart or you can hover over the company name to highlight it in the chart.
Access manpower numbers and the list of employee profiles
Lastly, you can hover over any of the bars to learn the specific manpower numbers for that hour in a pop-up as well as select a company name in the pop-up to view the list of corresponding employees. In the following GIF, the user hovers over the 10 AM bar and selects the GreenCrest Contractors company to view the list of employees.
Accessing manpower numbers and employee profiles
Updated over 1 year ago